Estimating the effect of Europe’s largest street party on crime in London
“The level of knife-related violence, aggression towards emergency workers, and on-the-street debauchery … is a fundamental betrayal of Notting Hill Carnival’s heritage and origins” Rakib Ehsan in CapX
“A two-day festival at which a million folk are having a wild time should not be judged by the villainy of a few” – Brendan O’Neill in The Spectator
“I dread this event every year, it gets more violent each time. How many more officers have to get injured or innocent members of the public killed?” – The Police Federation
“It’s a UK success story. I hope a few more of the naysayers experience it, before hastily jumping on the bandwagon of criticism!” – Leroy Logan in The Guardian
Working out how much crime is attributable to Carnival
Estimating Carnival-related crime is difficult
- Happens in neighbourhood with existing crime
- No clear boundary around event
- Crosses administrative boundaries
- Flags on crime reports inconsistent
We can’t do a randomised controlled trial …
… so we try to get as close as possible
… using a difference-in-difference model with two-way fixed effects
Step 1: create a grid of small cells covering London
Step 1: create a grid of small cells covering London
Step 2: count crimes of each type in each cell on each day
… June–October 2013–2023
… 15,462 grid cells × 1,323 days = 20,456,000 cell–day observations per crime type
Step 3: estimate the baseline daily frequency of crime in each grid cell
to account for population, socio-economic factors, land use, bars, shops, etc.
Step 4: estimate the London-wide frequency of crime on each day
to account for long-term trends, seasonal effects, public holidays, weather, etc.
After we take all that into account
… we’re left with only variation specific to each grid cell on a particular day
… and if Carnival had an effect on crime
- the difference in crime levels between Carnival and non-Carnival days in grid cells closer to Carnival
- would be bigger than the difference between Carnival and non-Carnival days in grid cells further away from Carnival
So, how much crime is attributable to Carnival?
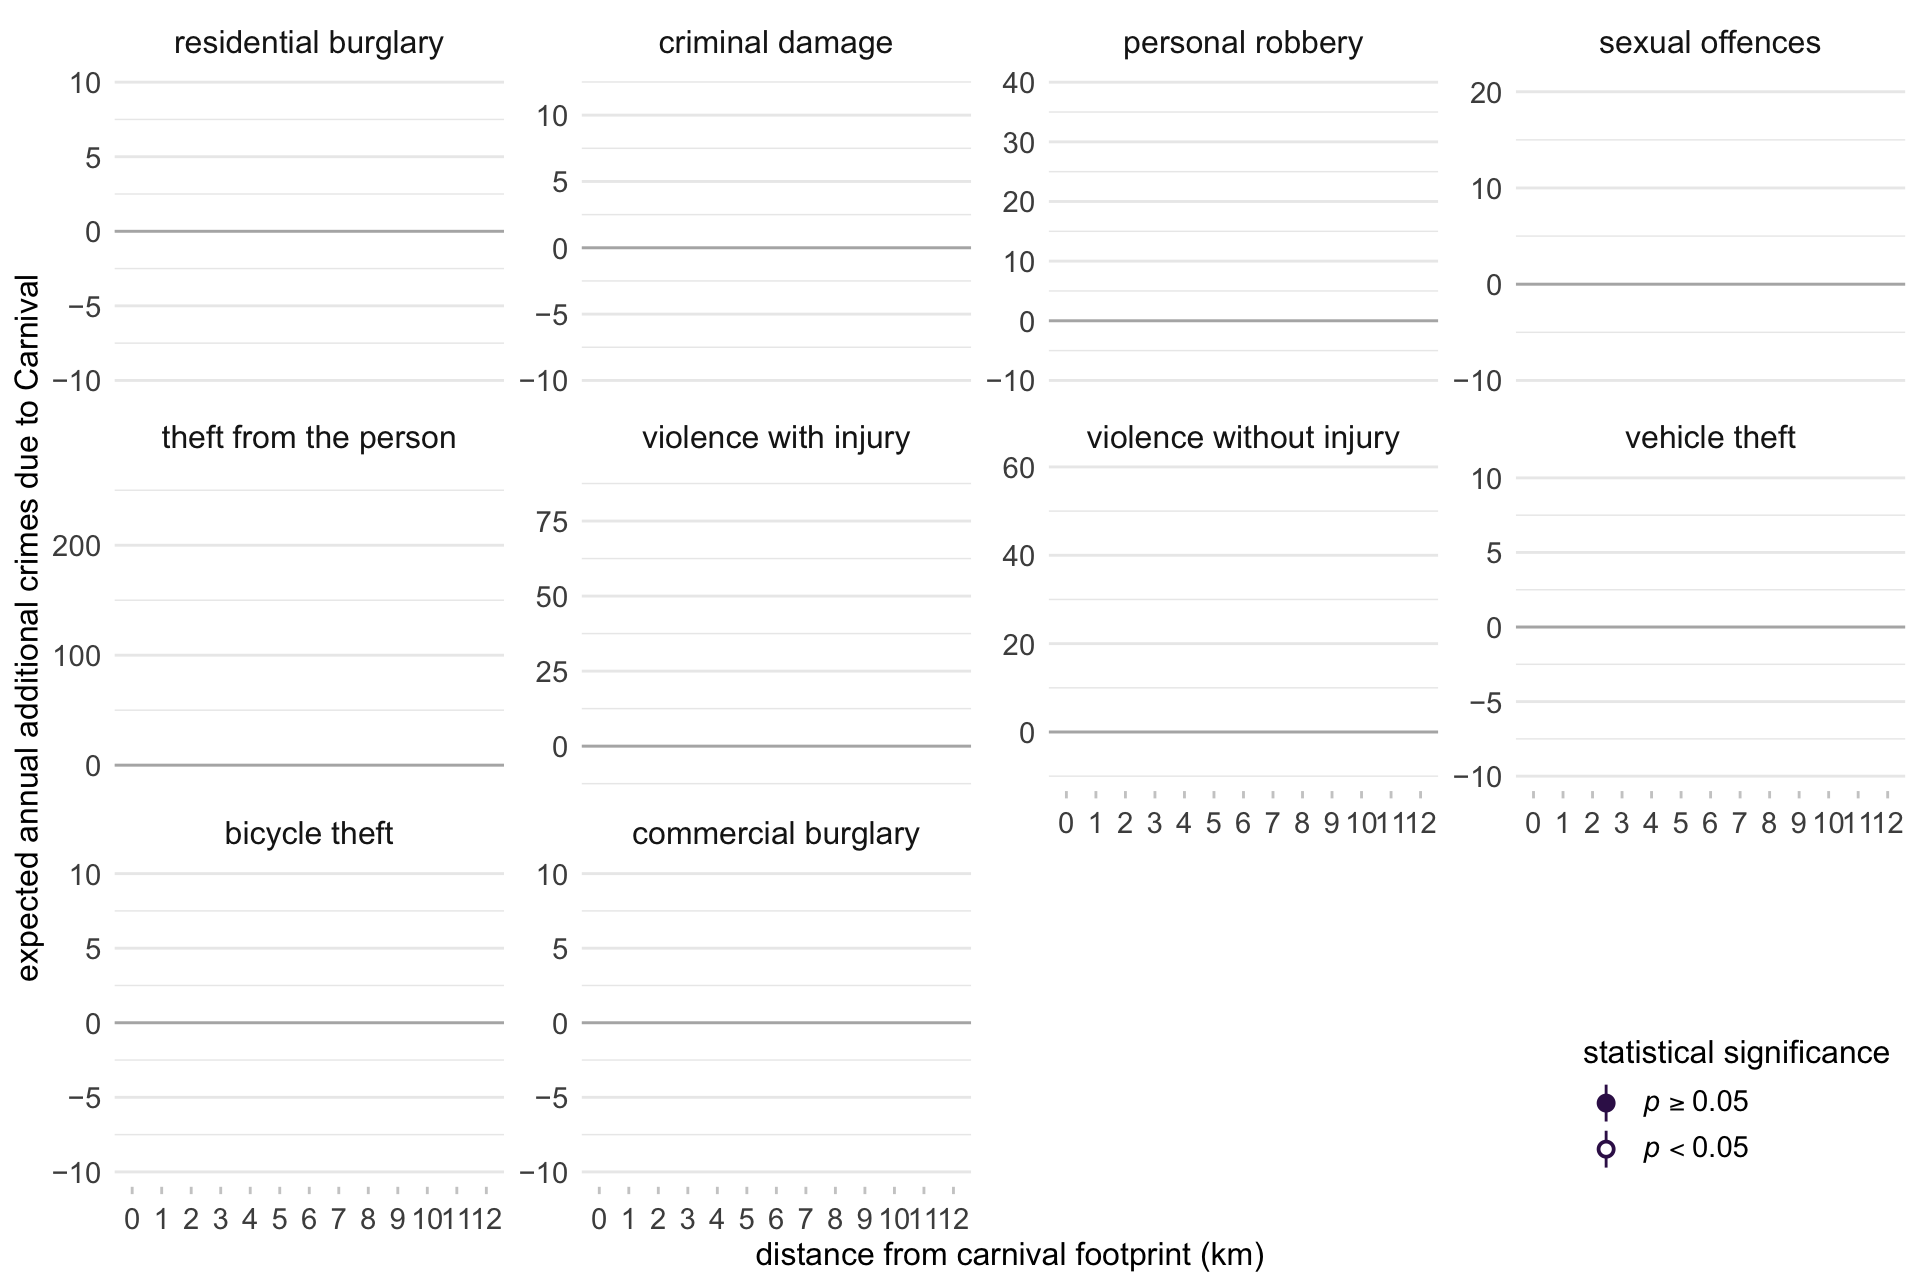
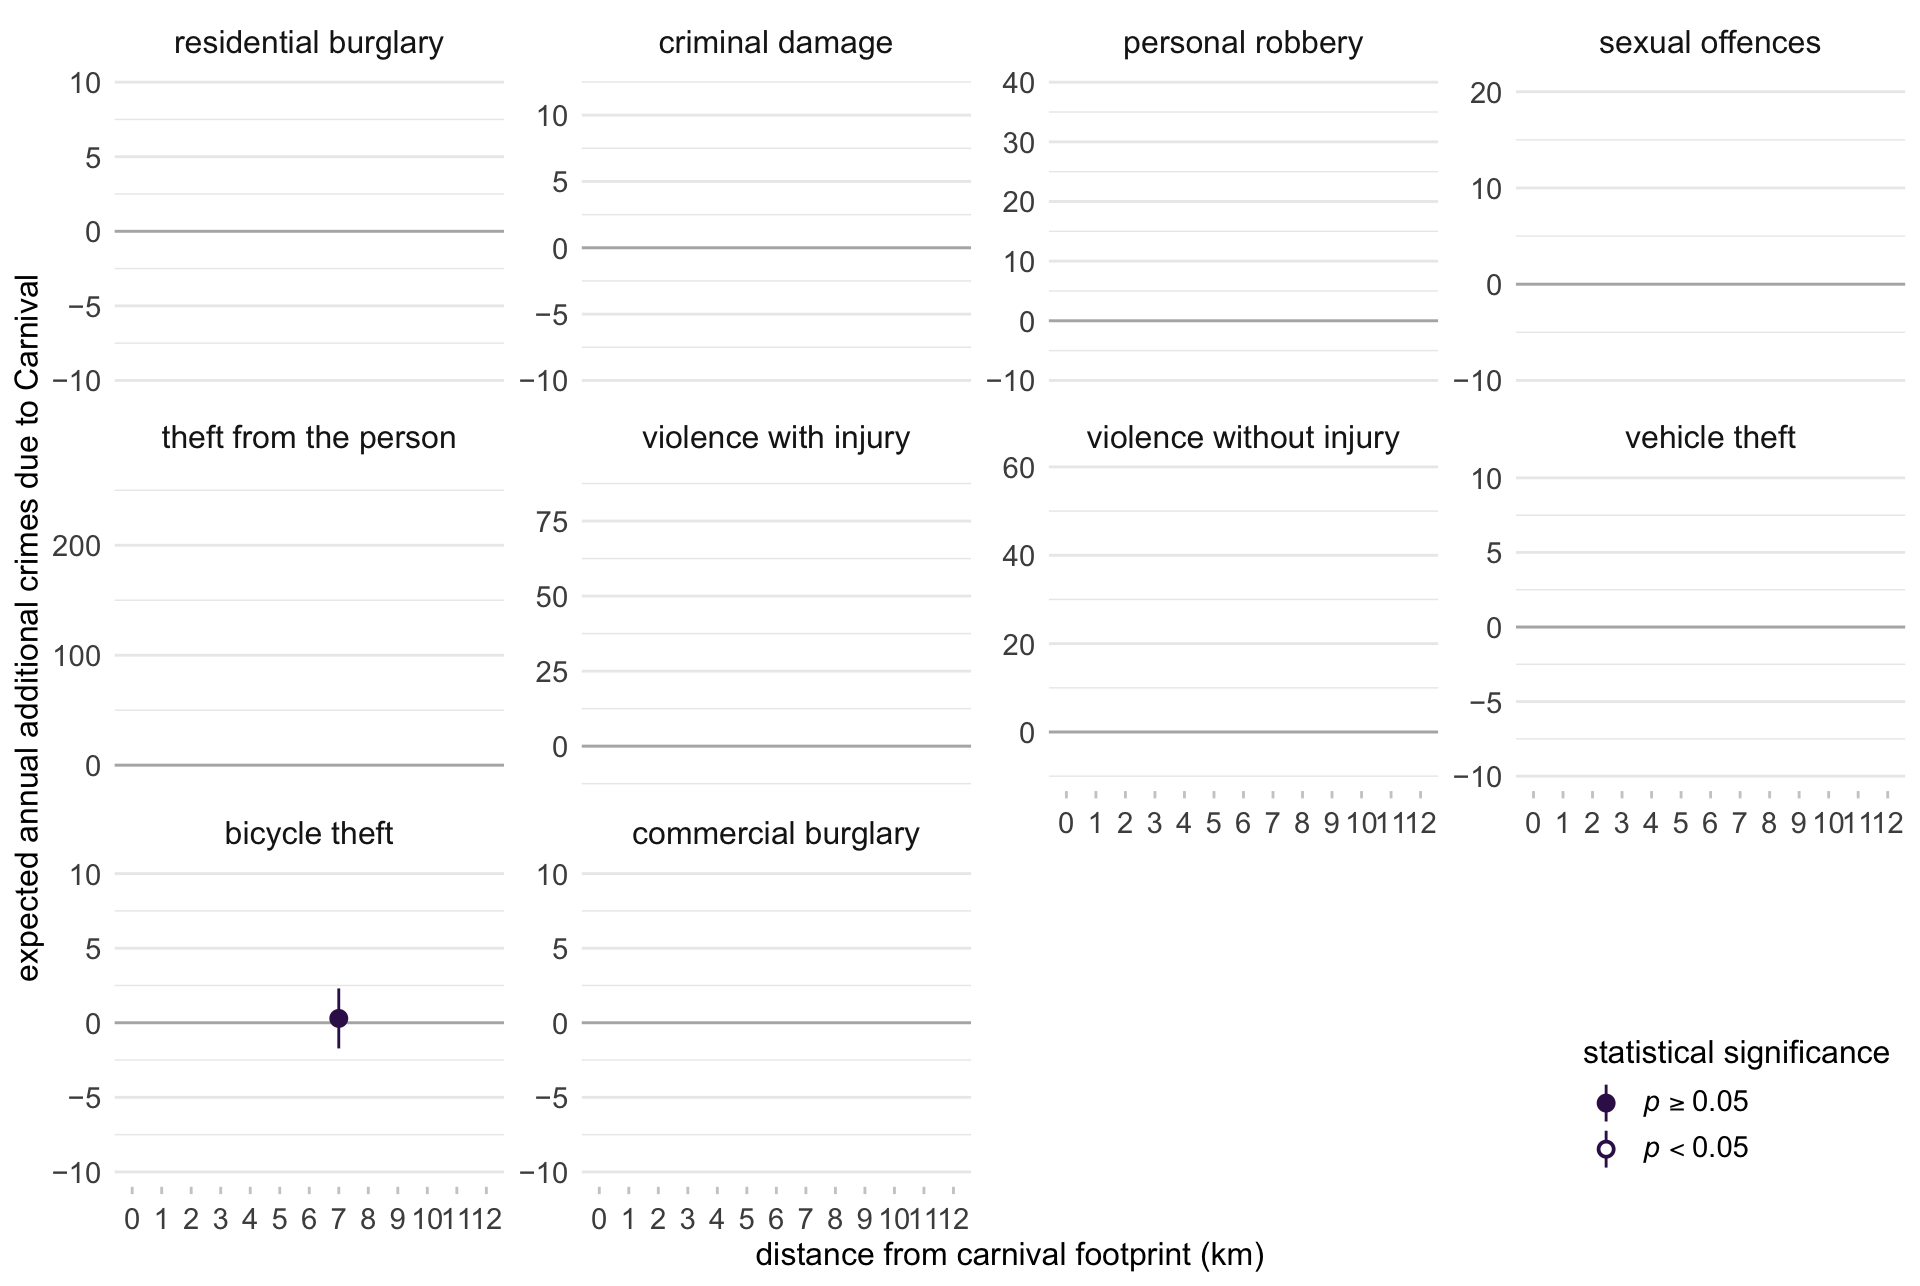
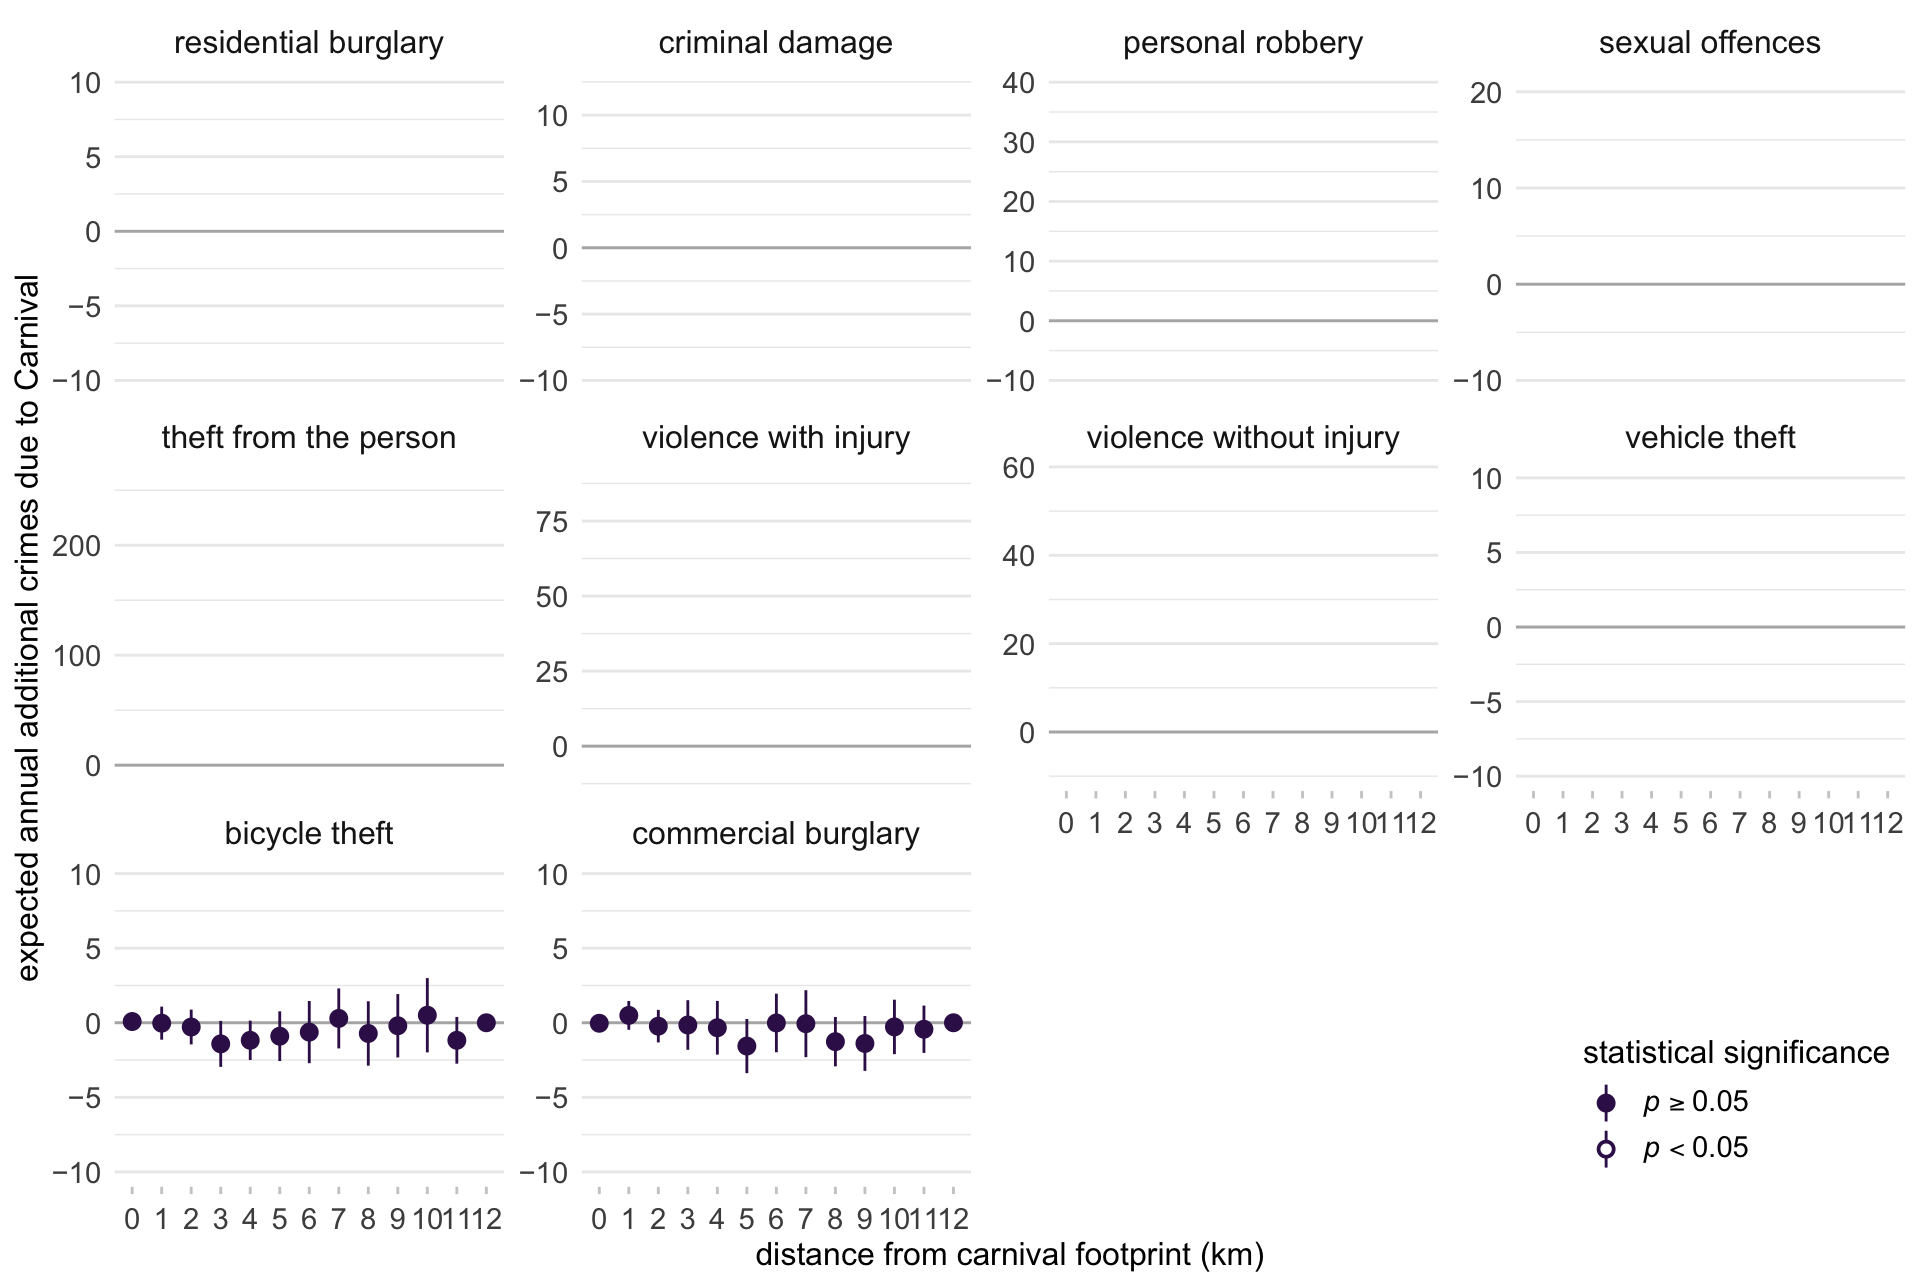
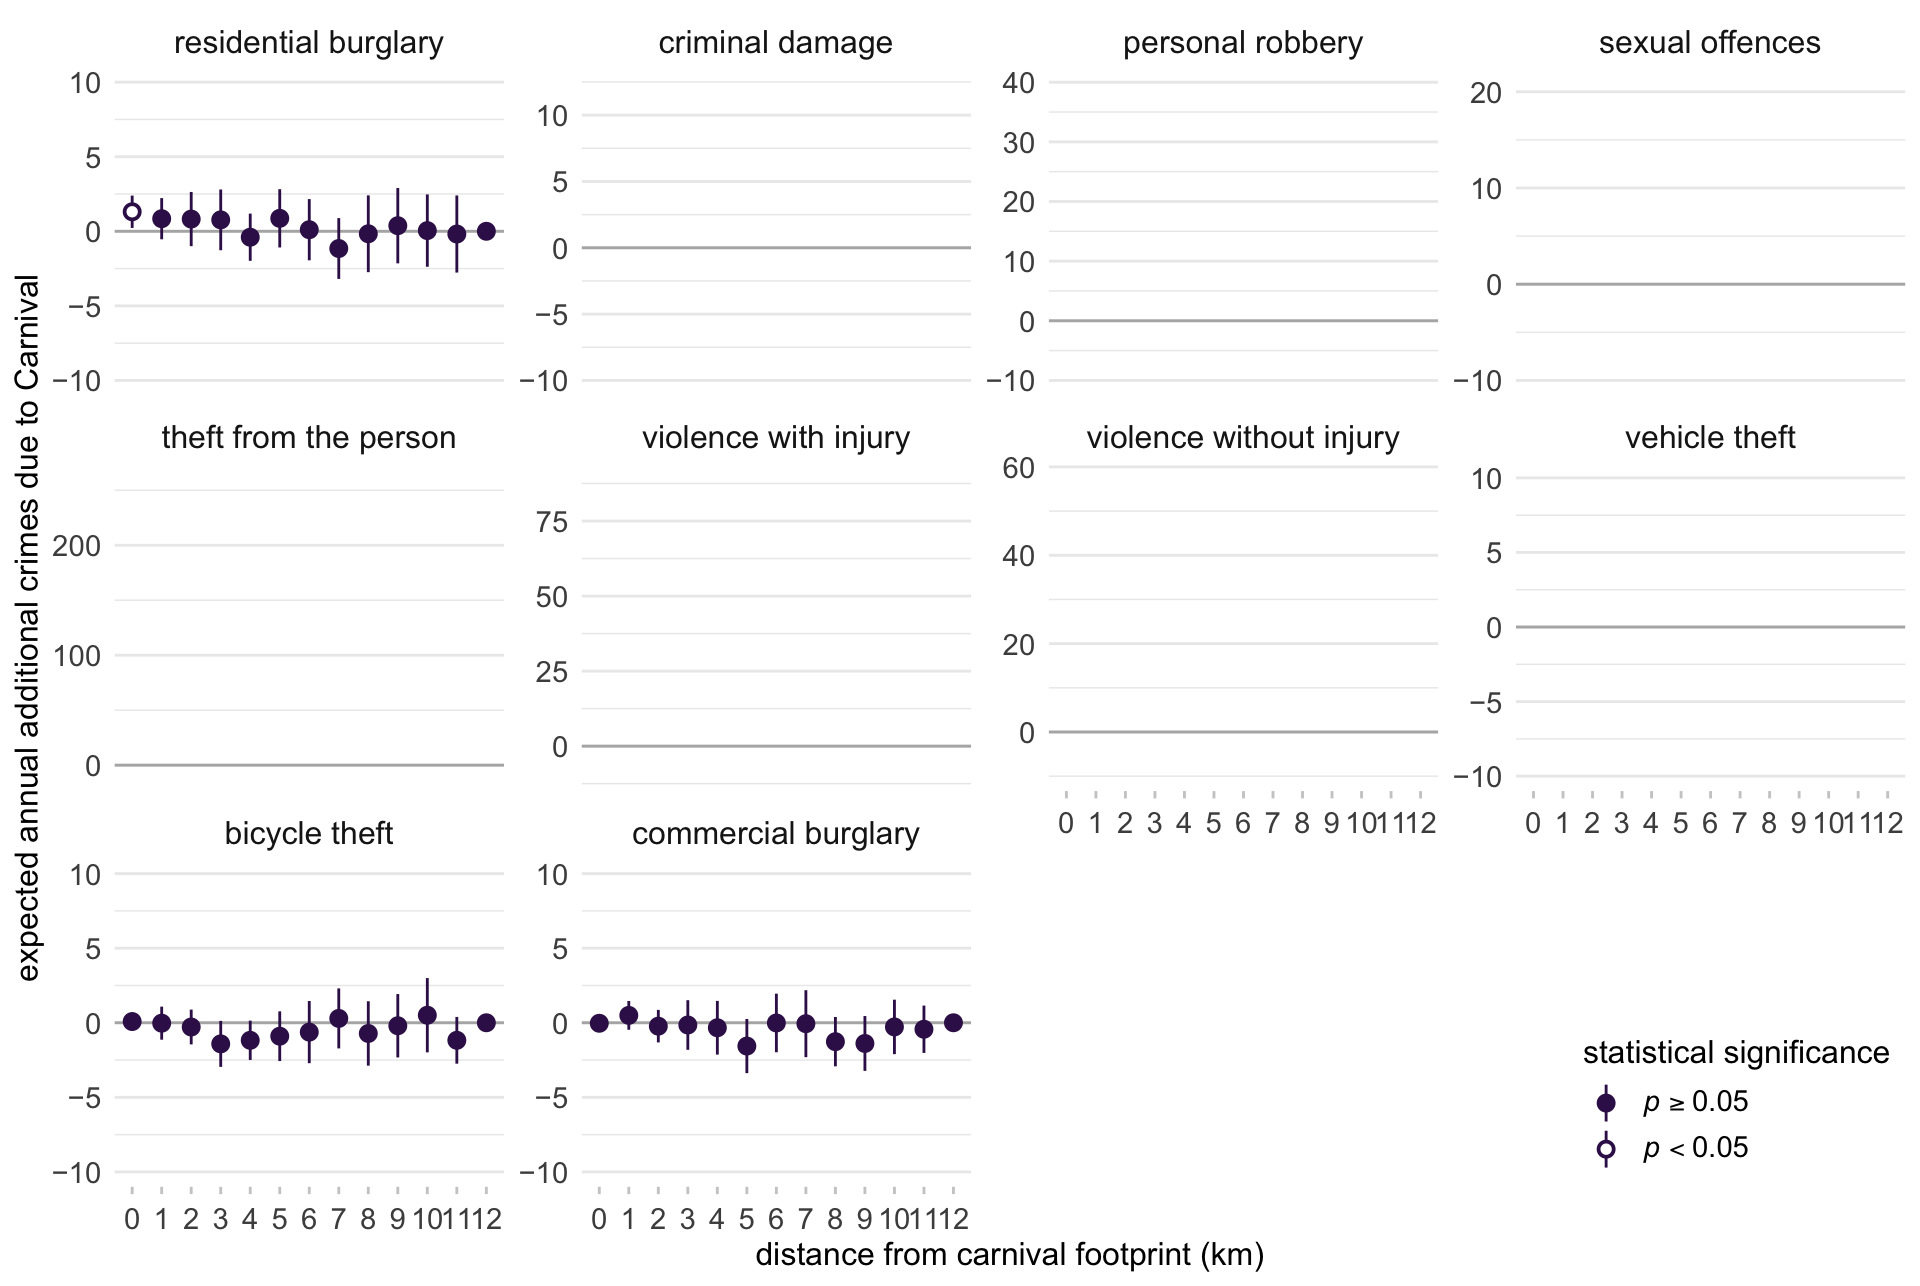

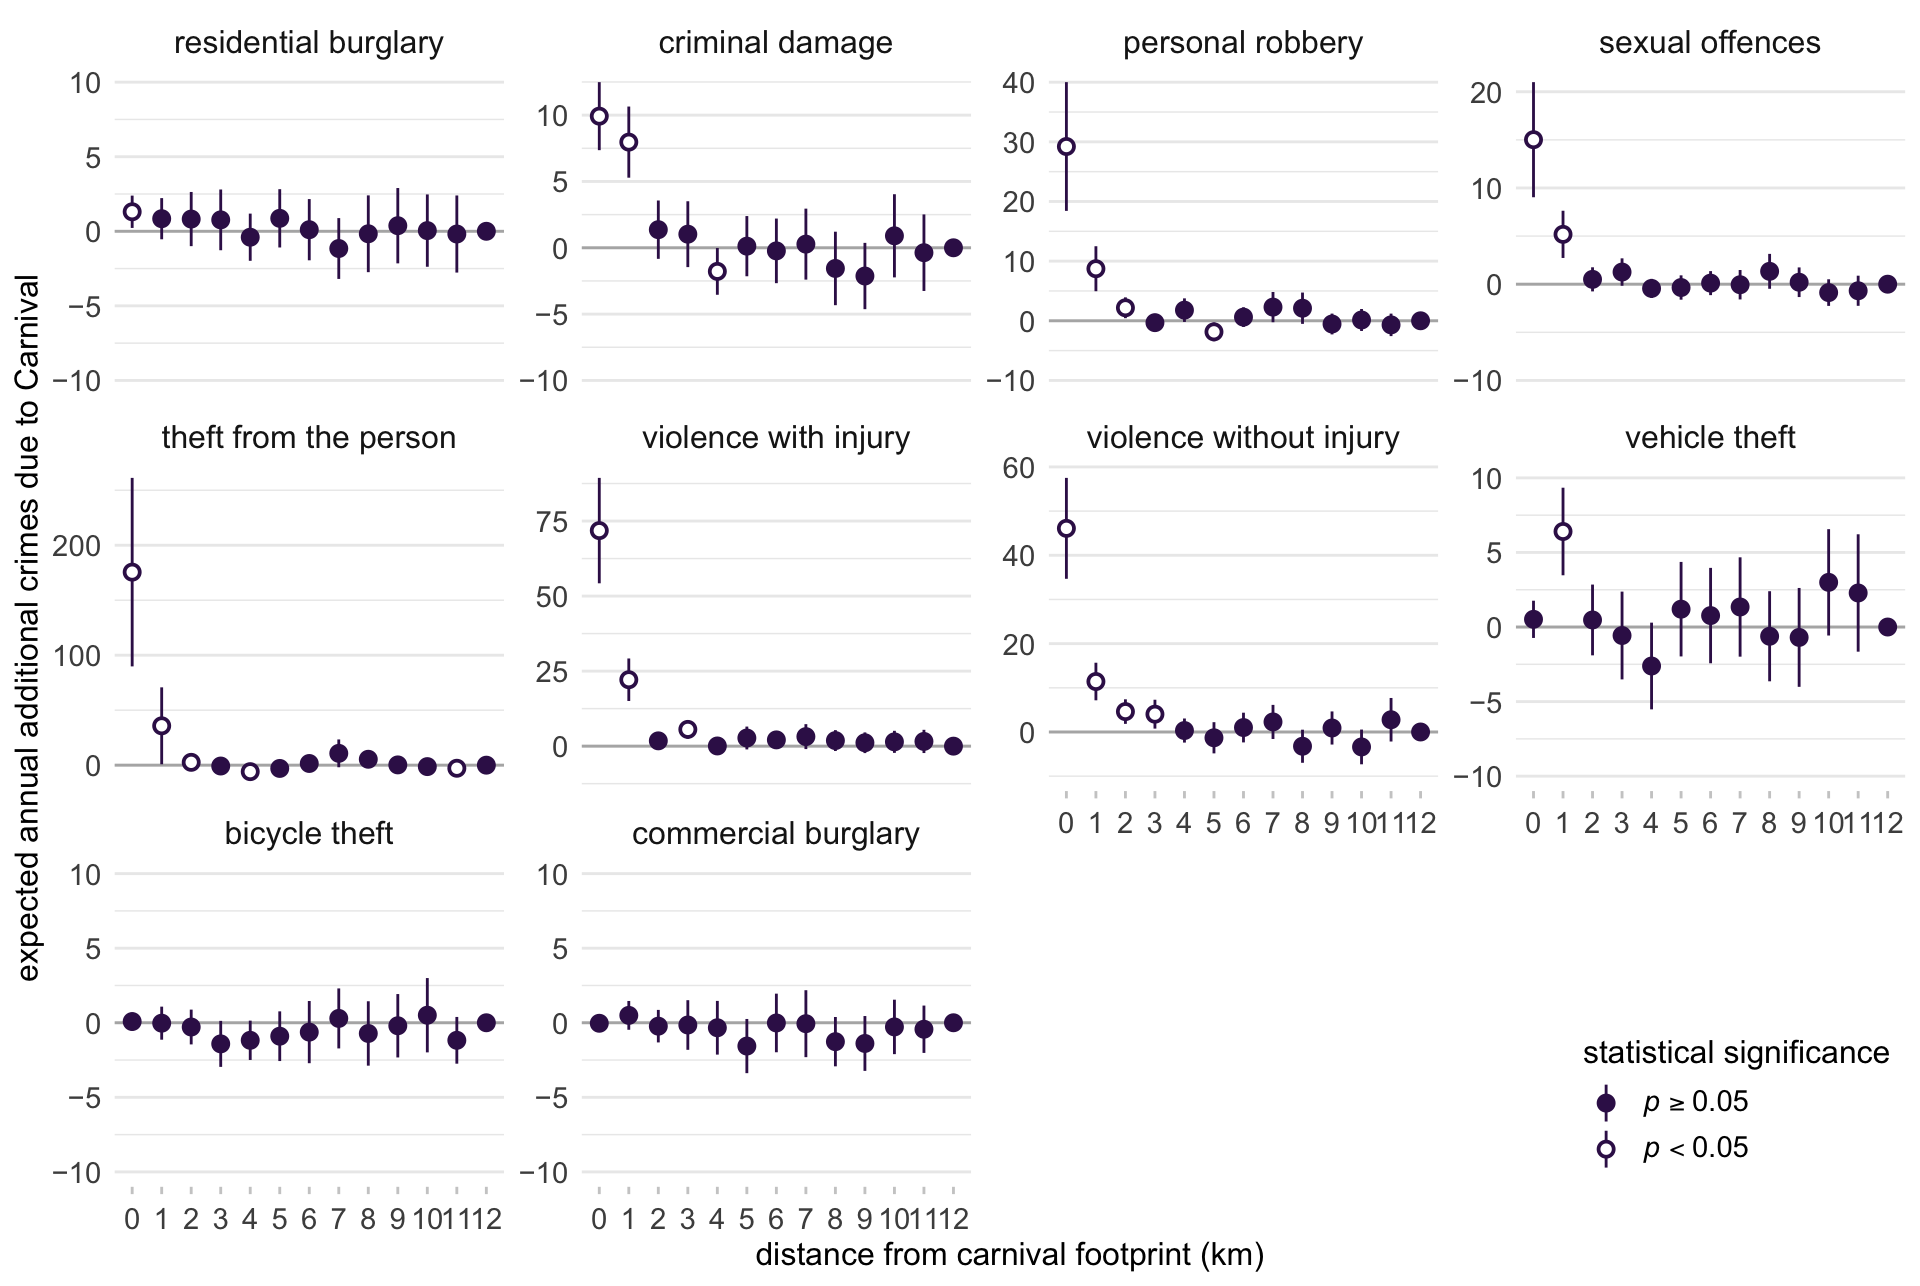
Additional crimes due to Carnival each year

Annual cost of additional crimes due to Carnival
| crime type |
estimated social cost (£)
|
estimated policing cost (£)
|
||
|---|---|---|---|---|
| estimate | 95% CI | estimate | 95% CI | |
| criminal damage | ||||
| personal robbery | ||||
| sexual offences | ||||
| theft from the person | ||||
| violence with injury | ||||
| violence without injury | ||||
Annual cost of additional crimes due to Carnival
| crime type |
estimated social cost (£)
|
estimated policing cost (£)
|
||
|---|---|---|---|---|
| estimate | 95% CI | estimate | 95% CI | |
| criminal damage | 34k | 8k to 60k | ||
| personal robbery | 687k | 427k to 947k | ||
| sexual offences | 552k | 280k to 824k | ||
| theft from the person | 418k | 225k to 611k | ||
| violence with injury | 3,091k | 2,400k to 3,781k | ||
| violence without injury | 540k | 367k to 714k | ||
Annual cost of additional crimes due to Carnival
| crime type |
estimated social cost (£)
|
estimated policing cost (£)
|
||
|---|---|---|---|---|
| estimate | 95% CI | estimate | 95% CI | |
| criminal damage | 34k | 8k to 60k | 5k | 1k to 9k |
| personal robbery | 687k | 427k to 947k | 106k | 66k to 146k |
| sexual offences | 552k | 280k to 824k | 94k | 48k to 140k |
| theft from the person | 418k | 225k to 611k | 219k | 118k to 321k |
| violence with injury | 3,091k | 2,400k to 3,781k | 295k | 229k to 361k |
| violence without injury | 540k | 367k to 714k | 36k | 24k to 48k |
Carnival vs London crime rates
| crime type | London rate2 |
rate per 100,000 in Carnival footprint, based on …1
|
|
|---|---|---|---|
| 2 million attendees | 1 million attendees | ||
| bicycle theft | |||
| commercial burglary | |||
| criminal damage | |||
| personal robbery | |||
| residential burglary | |||
| sexual offences | |||
| theft from the person | |||
| vehicle theft | |||
| violence with injury | |||
| violence without injury | |||
| 1 Assuming that on-average attendees spend 4 hours at Carnival (Movement Strategies 2017) | |||
| 2 Based on crimes on non-Carnival days, July–October in 2013–23, and London population of 8.79 million | |||
Carnival vs London crime rates
| crime type | London rate2 |
rate per 100,000 in Carnival footprint, based on …1
|
|
|---|---|---|---|
| 2 million attendees | 1 million attendees | ||
| bicycle theft | 0.7 | ||
| commercial burglary | 0.6 | ||
| criminal damage | 1.8 | ||
| personal robbery | 0.8 | ||
| residential burglary | 1.4 | ||
| sexual offences | 0.4 | ||
| theft from the person | 1.3 | ||
| vehicle theft | 3.1 | ||
| violence with injury | 2.2 | ||
| violence without injury | 3.8 | ||
| 1 Assuming that on-average attendees spend 4 hours at Carnival (Movement Strategies 2017) | |||
| 2 Based on crimes on non-Carnival days, July–October in 2013–23, and London population of 8.79 million | |||
Carnival vs London crime rates
| crime type | London rate2 |
rate per 100,000 in Carnival footprint, based on …1
|
|
|---|---|---|---|
| 2 million attendees | 1 million attendees | ||
| bicycle theft | 0.7 | 0.7 | 1.3 |
| commercial burglary | 0.6 | 0.5 | 1.1 |
| criminal damage | 1.8 | 7.0 | 14.0 |
| personal robbery | 0.8 | 18.0 | 36.0 |
| residential burglary | 1.4 | 1.7 | 3.5 |
| sexual offences | 0.4 | 9.3 | 18.5 |
| theft from the person | 1.3 | 106.2 | 212.4 |
| vehicle theft | 3.1 | 1.8 | 3.6 |
| violence with injury | 2.2 | 44.5 | 89.1 |
| violence without injury | 3.8 | 29.7 | 59.5 |
| 1 Assuming that on-average attendees spend 4 hours at Carnival (Movement Strategies 2017) | |||
| 2 Based on crimes on non-Carnival days, July–October in 2013–23, and London population of 8.79 million | |||
Conclusion
- Carnival leads to a significant increase in criminal damage, personal robbery, residential burglary, sexual offences, theft from the person, and violence with and without injury
- Many of these effects extend beyond the Carnival footprint
- The social costs of these additional crimes is between £3.71m and £6.94m per year
- The effect on overall crime in London is small
Thanks!
These slides
lesscrime.info/talk/eurocrim-2026/
Questions and comments
matthew.ashby@ucl.ac.uk